
On many occasions during our work to support organizations in their lean efforts, we have faced the challenge of having to represent visually processes that we can’t observe in action – for example, because they represent a future state that doesn’t exist yet. In such circumstances, without the guidance provided by the gemba, understanding how to carry out a process can be difficult.
The situations in which we can encounter this problem include:
- Unstructured or poorly defined processes, in which each person contributing to the process does the work in a different way. This is particularly common in administrative environments, where we see the personalization of process execution and its adaptation to the skills set or requirements of the process owners. In this case, results tend to be more important than the process itself.
- Processes required for the introduction of a new product or service to our offering (coming perhaps from another part of the business) or for diversification purposes. Processes can exist but not in the context of our business, like in the example of an organization introducing a product in a plant that was previously produced in another site.
- Product or process development activities and project management more in general, where the uniqueness of each process (they are tied to innovation and creativity) makes them hard to outline.
- Complete process redesigns.
I remember finding myself in one such situation, as I participated in process mapping for managing customer complaints in a company that designed and produced components for other manufacturers. The complexity of the system, due to several departments working in a disconnected fashion and to the use of different IT platforms (CRM, MRP, production planning, quality control, and so on) led to a cumbersome process that was hard to monitor and, in the eyes of the customer, excessively slow. “Adjusting” the process so it would better meet customer needs felt impossible and the team decided to altogether redesign it altogether keeping customer requirements as the main focus – rather than available resources and the company’s modus operandi. As a result, there was a 35% reduction of the activities necessary to execute the process and a 70% reduction in its lead-time (there were also a few phone calls from worried customers who asked whether something “strange” was happening in the business).
This situation is common enough that it’s worth identifying a structured way to tackle it. I am not claiming that the approach I’ll describe in this article is the best to approach this problem, but I must admit that every time I have used it I’ve seen positive results both for the process itself and for the learning of those involved.
It’s clear that, as Lean Thinking teaches us, any problem-solving initiative needs to start with the definition of the value expected or required by the customer (and, indeed, the identification of customers itself) and then of the sequence of activities that enable the creation of that value. We then need to find a way to establish continuous flow and customer pull, thus entering a cycle of continuous improvement that strives for process excellence. This is what Dan Jones and Jim Womack wrote in Lean Thinking. In the context of Total Quality Management (TQM) there is a tool that connects all of these aspects, known as SIPOC.
SIPOC allows us to define and study a process through the identification of the key elements required to execute it. It stands for Supplier – Input – Process – Output – Customer.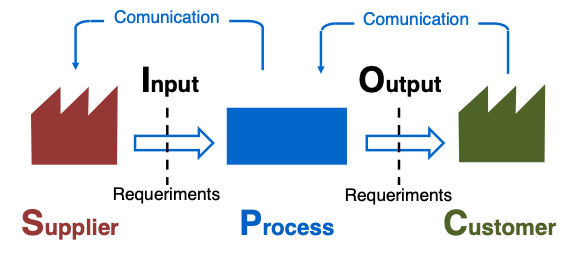
This tool, which is most commonly used in the world of Six Sigma and project management, is simple yet very powerful. It begins with the establishment of the beginning and the end of the process. Later on, we can draw five columns – one for each of the five elements of the tool – on a piece of paper.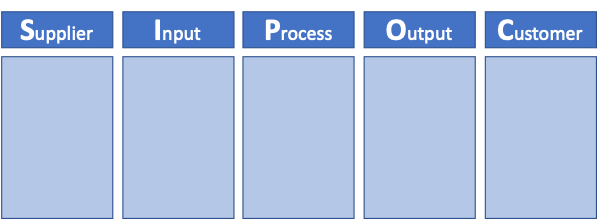
In a different version of the tool, two extra columns are included, referring to the specific requirements of the inputs necessary to execute the process and to the outputs necessary to satisfy the customer. These will help us define the process with even more clarity.
Finally, we fill the columns indicating the relationships between the different elements in the table. In the traditional approach, POCIS is the order followed: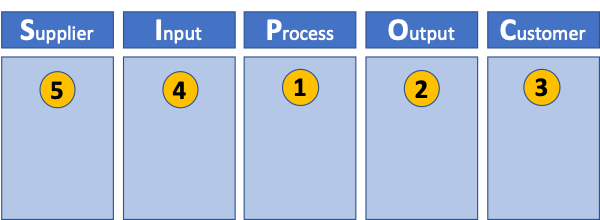
In fact, a variant of the tool is becoming increasingly popular, which changes the order of execution and corresponds to the acronym COPIS. This is a way to emphasize the importance of the customer in the definition of the process.
So, we start by identifying the customers the process touches – and that includes the users, the buyer and the internal customer. In certain cases, we even need to reflect the needs of customers like public administration or even society (for example, for dangerous, unhealthy or potentially harmful activities that might have a societal impact). If we can identify all the customers we need to serve, it will be much easier to understand what their expectations are.
Different customers can expect different things of the process. For instance, for a product like a sandwich, the user will focus on things like food safety, quality and price, while the process owner (the seller in this case) will look at margins, selling prices and the ability of taking a big market share. A good characterization of the process needs to take into account both types of clients in order to ensure we can remain their favorite supplier. Therefore, we need to specify the outputs required by these customers – the value they expect. We have to translate them into measurable aspects and clear objectives to ensure the execution of the process answers to the right parameters.
To effectively define customer value, we have many tools at our disposal, like VOC (Voice of the Customer), surveys, market study reports and, in many cases, a rigorous analysis of customer complaints and of the sales funnel. At the moment of including a value item to the table, it’s important to connect it to the customer it is aimed at and to what that customer expects of it. This way, we’ll have more control over the system and we’ll be able to verify the requirements are being met (don’t forget we are living in an environment of great volatility, uncertainty, complexity and ambiguity – VUCA – in which customer requirements change all the time).
Now it’s time to define the process. To do that, we start with the final product and go about identifying each of the activities necessary to achieve the proposition spelled out in the Outputs column. At this point it’s a good idea not to be too detailed in the definition of activities, to avoid overcomplicating its visual representation and limiting the effectiveness of this tool. In any case, we begin to connect activities to each other, in a sequence, until we can guarantee the achievement of all the outputs identified in the SIPOC.
Here, it’s worth keeping in mind what we will find (this graphic refers to a simplified process, of course):
The interconnection of activities creates a scenario where a given activity (say, P3) is simultaneously part of the process (one of the x number of steps it consists of), customer (of activity P2, with the specific requirements I3 that will in turn form part of the O2) and supplier of the activity P4. It’s very common for intermediate outputs to appear, required by internal clients (the next step in the process), without having been identified in the preliminary study of the customers of the global process. In SIPOC, this situation will translate into the appearance of outputs in certain activities that will then become inputs in the following steps. This is exactly why I recommend carrying out this process step by step, from the end to the beginning of the process and by using sticky notes on a piece of brown paper hanging to the wall to allow us to easily update the result.
At this stage, for each activity included in the process, we need to identify the specific requirements to ensure the achievement of the operational result defined by the inputs (or at least minimize the risk of variation in the results).
Finally, for each input coming from outside the system (that is not the output of a previous step) we need to identify the best supplier that can provide it to us under the conditions defined in the requirements.
The following image show a simplified example of the SIPOC exercise for the preparation of coffee for a family’s breakfast using a filter coffee machine.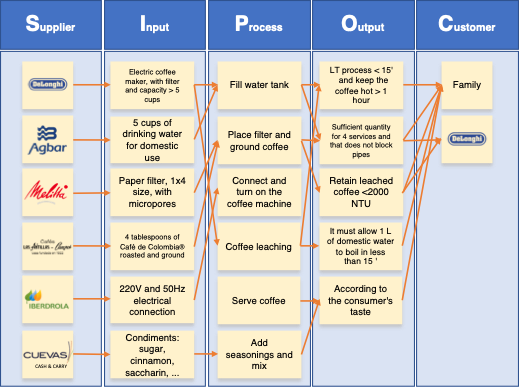
It’s worth emphasizing that the very mechanism of execution of this tool facilitates teamwork and the participation of everyone, as people are called to add sticky notes to a board and discuss as the table is filled up.
The processes we typically work with in real life, however, are way more complicated that those described until now. One of the biggest difficulties they present is the identification of the sequence of activities. There isn’t only one that leads to the desired outcome, so which one should we use? How do we know we have chosen the right one? To answer these questions, we can rely on another popular project-management tool: the diagram of precedence. This graphic tool allows us to represent all of the possible ways in which a process can be completed, deriving from different possible sequences.
As an example, let’s imagine a very simple process we all know intimately – waking up in the morning and getting ready to go to work. This process starts when the alarm goes off and ends when we step out of the door, its objective being getting ready and arriving at work on time. These are the activities we’d need to carry out:
- A: Waking up
- B: Preparing breakfast
- C: Eating breakfast
- D: Tidying up the kitchen
- E: Showering
- F: Drying our hair
- G: Using the bathroom
- H: Brushing our teeth
- I: Checking the traffic report
- J: Getting dressed
- K: Grabbing our backpack/bag and the car keys
- L: Putting on shoes and jacket
- M: Making the bed
- N: Leaving the house
This sequence is not the only one possible, nor is it necessarily the best one for us all. The diagram of precedence visualizes the interdependencies between the activities, to tell us which ones need to be carried out before. We need to make breakfast before we can eat it!
We can classify the dependencies as:
- Necessary – they are inherent to the nature of the activity and we can’t change them.
- Discretionary – without any obligations, they answer to a preferred sequence stemming from different situational criteria.
- External – they derive from external determining factors on which we normally do not act, like the availability of a certain type of resource.
I recommend starting with the necessary ones, since the others can depend on groundless decisions (“I have always done it this way!”) and can’t be acted upon without a deep understanding of the process. This way we get this diagram: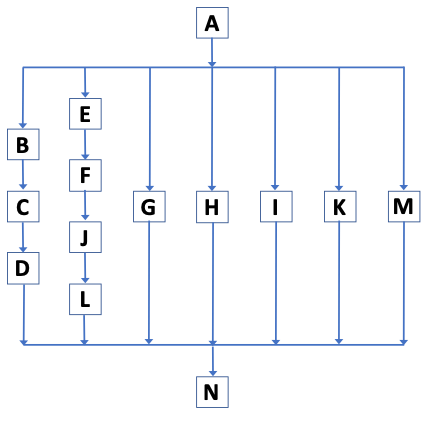
What the diagram shows is that the process always has to start with “waking up”. From that moment, we have options: we can “prepare breakfast”, “shower”, “use the bathroom”, “brush teeth”, “check the traffic report” or “make the bed”, but we can’t have breakfast because we need to prepare it first. And so it continues. Using the diagram we can obtain the different possible sequences of activities based on what we want to achieve. For instance, I will only grab my backpack and the car keys as a second to last activity before leaving the house, because if I do it at any other time it will make it harder for me to carry out the other steps.
So, to limit the amount of unnecessary movement, when we get into the bathroom we should complete all the tasks that can be completed in there. In the same way, I can avoid sitting idle by making the bed while the coffee machine is preparing the coffee. In both instances, we’d be acting on the lead-time and the cost of the process. With a diagram of precedence, we can control how we carry out a process and adapt to changing circumstances easily and quickly.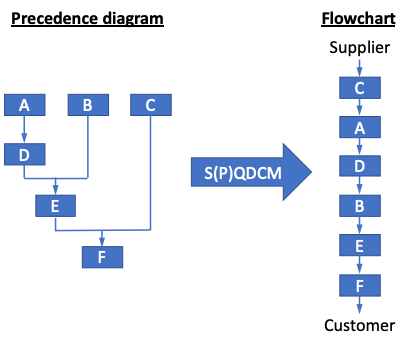
Once we have defined the sequence of tasks we need to obtain the desired outcome, we can translate it to our value stream map to continue with our analysis and improvement of the overall process – the only proviso being that without access to a gemba all the data related to operations and work-in-progress need to come from estimation (but that’s another story).
Combining SIPOC with diagrams of precedence and value analysis we’ll be able to design a process we can improve and get the most out of, while developing knowledge on the work to consistently deliver maximum value to customers with the minimum use of resources.